Association of Chronic Vascular Injury with Long-Term Renal Allograft Function and Mycophenolate Dose- a Single-Center Retrospective Study
Abstract
Contribution of chronic renal allograft vascular changes to the long-term graft function and its relationship with maintenance immunosuppression is incompletely understood. Therefore, we conducted a retrospective, single- center study in 163 kidney, or kidney-pancreas recipients, who had implantation and 12-month protocol biopsy, to assess relationship between renal vascular changes and renal function up to three years post-transplant. Immunosuppression consisted of tacrolimus and mycophenolate ± steroids. Renal histology was interpreted according to the Banff classification. Glomerular Filtration Rate (eGFR) was estimated using MDRD formula. In a multivariate analysis, 12-month arterial fibrointimal thickening (cv), but not arteriolar hyalinosis (ah) independently correlated with lower eGFR up to 3 years post-transplant. A lower 12-month cv was independently associated with lower implantation ah score and with higher average first-year posttransplant MMF dose. In multiple logistic regression, an increase in cv was less likely with younger donor age, and with higher average first-year MMF dose. 12-month ah independently correlated with ah at implantation and with donor age. First-year increase in ah was more likely in recipients of older kidneys and with lower implantation ah scores. In conclusion, the 12-month cv and its first-year posttransplant increase, may be independent predictors of GFR. Intensified MMF dosing during first post-transplant year may decrease progression of renal arterial fibrointimal thickening.
Kidney transplantation; Glomerular filtration rate; Arteriolar hyalinosis; Arterial fibrointimal thickening; Mycophenolate mofetil
INTRODUCTION
Despite significant advances in the post-transplant care of kidney transplant patients, long-term graft outcome is still suboptimal. Annual death-censored renal allograft attrition rate after first post-transplant year remains 1-3% in the USA and in Europe [1]. Several studies have evaluated renal chronic vascular changes (arterial fibrointimal thickening and/or arteriolar hyalinosis) as risk factors for inferior graft function and/or decreased graft survival, with mixed results [2-4]. However, in some of these studies only univariate analysis of the relationship of chronic vascular changes with graft outcome was performed, and frequently, reports were based on cyclosporine-treated patients. In addition, while several reports analysed an association of chronic vascular lesions with the type of and exposure to a calcineurin inhibitor [4], there is almost a complete lack of data on association of mycophenolate with progression of chronic vascular changes. Therefore, the aim of the present study was to address in a contemporary, tacrolimus-treated cohort of kidney and kidney-pancreas transplant recipients, the relationship between chronic renal allograft vascular changes assessed on 1-year protocol biopsies and renal function up to three years post-transplant. We also evaluated association of renal vascular changes during first post-transplant year with maintenance immunosuppression.
MATERIALS AND METHODS
This is a retrospective study at the University Hospital Merkur, Zagreb, Croatia. The Merkur Hospital and the University of Zagreb School of Medicine ethics committees approved the study. This study has been performed in accordance with the ethical standards as laid down in the declaration of Helsinki, as well as in the declaration of Istanbul. Being a retrospective study, informed consent for inclusion in the study was not obtained. However, all patients gave their informed consent at time of waiting list, for use for research purposes of data originating from the standard patient care. We included in this study 163 consecutive kidney and simultaneous kidney and pancreas transplant recipients, transplanted at the Merkur Hospital between 2007 and 2014, who had protocol biopsies at implantation and at 12 months after transplantation. Recipient allocation was performed under Eurotransplant rules, with a negative CDC cross-match as a prerequisite. An anti-CD25 antibody, basiliximab (Simulect, Novartis) or daclizumab (Zenapax, Roche), a T-cell depleting antibody (ATG-F, Fresenius or Thymoglobulin, Genzyme), or rituximab (Mabthera, Roche) was used for induction of immunosuppression (Table 1). All patients received steroids for induction and for up to five days post-transplant. Thereafter, a steroid-free maintenance was employed in immunologically low-risk recipients (virtual PRA less than 20% and no pre transplant donor-specific antibodies detected by Luminex), without Delayed Graft Function (DGF) and without acute rejection episode during first five post-transplant days. For the purpose of the present study, steroid-free immunosuppression was considered in a modified intention-to-treat way (i.e., at least one day off steroids). Steroids were reintroduced in case of acute rejection. Maintenance immunosuppression consisted of tacrolimus (Prograf, Astellas) and mycophenolate mofetil (CellCept, Roche), or mycophenolate sodium (Myfortic, Novartis). For statistical analysis, mycophenolate sodium doses were expressed as mycophenolate mofetil equivalents, assuming that 720 mg of mycophenolate sodium was equivalent to 1 g of mycophenolate mofetil. Tacrolimus dose was adjusted according to Co concentrations. Mycophenolate dose during f irst post-transplant year was targeted to 3 g per day, as tolerated. Average mycophenolate dose, or tacrolimus concentration was calculated from 1 and 3month values (a three-month average dose or concentration), or from 1-3-6- and 12-month values (a f irst-year average dose or concentration).
| Recipient | N=163 |
| Age (years) | 47.8 ± 12.1 |
| Gender (f/m) | 49/114 |
| Primary kidney disease, n (%) | |
| Glomerulonephritis/vasculitis | 47 (29) |
| Diabetic nephropathy | 40 (25) |
| ADPKD | 18 (11) |
| Hypertension | 9 (5) |
| Other/unknown | 49 (30) |
| Panel reactive antibodies, % (range) | 5.0 ± 19.6 (0-99) |
| Donor | |
| Donor type (living/deceased) | 25/138 |
| Donor age (years) | 45.9 ± 15.1 |
| Transplant | |
| HLA mismatch | |
| A | 1.0 ± 0.7 |
| B | 1.4 ± 0.6 |
| DR | 1.1 ± 0.7 |
| Organ (kidney only/SPKT) | 137/26 |
| Delayed graft function (yes/no) | 60/103 |
| Induction antibody, n (%) Anti-IL2 | 156 (96) |
| ATG | 5 (3) |
| Rituximab | 2 (1) |
| Steroid-free (yes/no) | 65/98 |
| Acute rejection in the first year, n (%) | |
| Without rejection | 113 (69) |
| T-cell mediated rejection | 44 (27) |
| Antibody-mediated rejection | 1 (0.6) |
| Mixed T-cell and antibody-mediated rejection | 5 (3) |
| BK virus nephropathy, n (%) | 12 (7) |
Table 1: Recipient, donor and transplant characteristics.
All patients received sulfometoxasole/trimethoprim during first year, as well as valganciclovir for 6 months post-transplant. Patients also received diltiazem, 30-90 mg bid, throughout the entire post-transplant period.
Kidney biopsy specimens were formalin-fixed, paraffin embedded and cut into serial sections. Slides were analyzed by an experienced renal pathologist. Protocol biopsies at implantation and at 12 months post-transplant represents standard of kidney transplant patient care at our center, and their performance is based on informed patient preference. Implantation biopsies were wedge biopsies in most cases. Post-transplant biopsies were taken by an automated biopsy gun under ultrasound guidance, using a 16G, or 18G needle. Biopsies were analyzed according to the Banff classification [5,6]. Only biopsies with sufficient tissue for Banff grading were included for analysis of chronic histology scores. For cause biopsies were performed in case of DGF lasting for ≥ 7 days, as well as in case of unexplained worsening of renal function and/or proteinuria. All rejection episodes were biopsy-proven. We included both clinical and subclinical rejection episodes, with a grade greater than borderline. All T cell-mediated rejection episodes of grade IA and IB were treated by pulse methylprednisolone (500 mg i.v. qd for three days). T cell-mediated rejections of a grade ≥ IIA, as well as steroid-resistant rejections were treated by anti-thymocyte immunoglobulin (ATG-F, Fresenius or Thymoglobuline, Genzyme). Antibody-mediated rejections were treated with a combination of methylprednisolone boluses (as above) and plasma exchange.
Renal Glomerular Filtration Rate (eGFR) was estimated using a 4 variable MDRD formula and was expressed as ml/min/1,73 m [2,7]. Statistical analysis. Numerical data are presented as means ± SD. Correlation between two continuous variables was tested using a Pearson correlation. Partial correlation was employed when eGFR at 24 and 36 months was analysed with respect to 12-month histology scores, for the correlation to better reflect a kidney function change during a preceding 12-month period. For that, eGFR at 24 months was partialized by eGFR at 12 months and eGFR at 36 months by eGFR at 24 months, respectively. Difference between two groups in continuous variables was tested with student t test (for either dependent, or independent samples, as appropriate) and with χ2 test in case of frequencies. Multiple regression analyses were performed to determine predictive factors for kidney function up to 36 months after transplantation. Analysis of covariance was used to test predictive factors for chronic allograft scores at 12 months after transplantation. In the multivariate analyses were included only variables that were associated with respective outcome at p ≤ 0.1 in univariate analysis. Statistical significance was considered at a two-tailed p<0.05. All statistical analyses were performed using Statistica 13 software (Dell Inc., Tulsa, OK, USA). Graphs were created using Prism 7 (GraphPad, USA).
RESULTS
Study flow diagram is presented in Figure 1. Recipient, donor and transplant data are shown in Table 1. The present cohort consisted of predominantly deceased donor, low immunological risk kidney transplant recipients. Majority of patients received anti IL2 induction (daclizumab, or basiliximab), and about 40% of patients were on steroid-free maintenance immunosuppression.
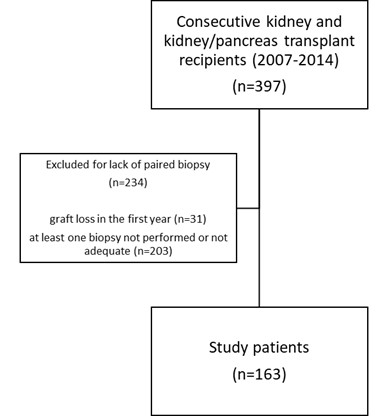
Figure 1:Study flow diagram.
Chronic vascular scores at transplant and at 12 months post transplant.
Chronic vascular scores at implantation and at 12-month post transplantation are shown in Table 2. There was an increase in average Arteriolar Hyalinosis (ah) score over one year. Nevertheless, average arterial fibrointimal thickening (cv) score at 12 months was not significantly different from the basal cv score. A 12-month change (Δ) of vascular scores was also assessed as a binary variable (i.e. progression vs. no progression). ah and cv scores increased in a proportion of patients (30% and 20%, respectively).
| N=163 | baseline | 12-months | p |
|---|---|---|---|
| arterial fibrointimal thickening (cv) | 0.37 ± 0.82 | 0.48 ± 0.91 | 0.236 |
| arteriolar hyalinosis (ah) | 0.96 ± 1.09 | 1.13 ± 1.16 | 0.041 |
Table 2: Chronic vascular scores at implantation and at 12-months post-transplant.
Association of eGFR and chronic scores
Correlation of eGFR at 12, 24 and 36 months with 12-month cv and ah score, as well as with the ci, ct and total inflammation (ti) score is shown in Table 3. In a multiple regression analysis, only an association of eGFR with 12-month cv score persisted at 12, 24 and 36-months post-transplant (Table 4). For the multiple regression, we used ct score and omitted ci, because of their co-linearity. We also assessed whether a 12-month increase in chronic vascular scores was associated with eGFR up to three years post-transplant. An increase in cv negatively correlated with eGFR at 12, 24 and 36 months (Figure 2A). Δah was not associated with eGFR during three years post-transplant (Figure 2B). Similarly, an increase in ci and ct during first year was not associated with decreased eGFR at 1, 2 and 3 years post transplant (results not shown).
| Score at 12 months | eGFR (ml/min/1.73 m2) | ||
|---|---|---|---|
| 12 months (N=163) | 24 months (N=148)* | 36 months (N=125)** | |
| arterial fibrointimal thickening (cv) | -0.262 | -0.321 | -0.129 |
| p=.001 | p=.001 | p=.154 | |
| arteriolar hyalinosis (ah) | -0.222 | -0.079 | -0.012 |
| p=.004 | p=.344 | p=.895 | |
| transplant glomerulopathy (cg) |
-0.015 | -0.176 | -0.091 |
| p=.848 | p=.033 | p=.316 | |
| interstitial fibrosis (ci) | -0.169 | -0.209 | -0.049 |
| p=.031 | p=.011 | p=.592 | |
| tubule atrophy (ct) | -0.166 | -0.145 | -0.025 |
| p=.034 | p=.080 | p=.786 | |
| total inflammation (ti) | -0.163 | -0.106 | -0.108 |
| p=.042 | p=.213 | p=.242 | |
| Note: (*): Partialized for eGFR at 12 months; (**): Partialized for eGFR at 24 months | |||
Table 3: Correlation of chronic scores and total inflammation (ti) at one-year post-transplant with eGFR.
| N=163 | Β | -95% Cnf. Lmt. | +95% Cnf. Lmt. | p-value |
|---|---|---|---|---|
| Tubule atrophy | -0.008 | -0.273 | 0.258 | 0.953 |
| Arterial fibrointimal thickening (cv) | -0.185 | -0.363 | -0.008 | 0.041 |
| Arteriolar hyalinosis (ah) | -0.134 | -0.313 | 0.045 | 0.141 |
| Total inflammation (ti) | -0.057 | -0.314 | 0.199 | 0.661 |
Table 4: Multiple regression analysis of the association of 1-year chronic scores with 1-year renal allograft function.
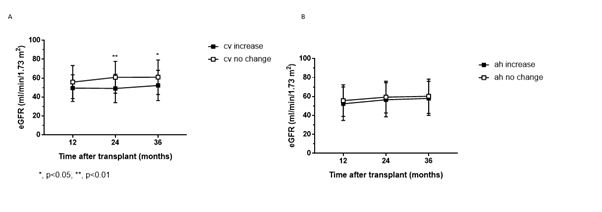
Figure 2: A: Relationship between eGFR and. Δcv during the first year (cv increase=closed squares; no change=open squares). B: Relationship between eGFR and Δah during the first year (ah) increase=closed squares; no change=open squares). Note: Only patients whose implantation cv, or ah score was <2 were included.
Factors associated with the cv score at 12 months post-transplant, or with its progression during first post-transplant year.
In a univariate analysis (Table 5), the 12-month cv score positively correlated with recipient and donor age, with DGF and borderline significant association with steroid-free immunosuppression. 12-month cv score was not associated with donor or recipient gender, HLA mismatch, PRA, or with occurrence of acute rejection in the first year. cv score at 12 months was positively associated with the cv, ah, ci and ct scores at implantation and with all 12-month chronic scores. There was a negative correlation between the 12-month cv and average tacrolimus concentration at 1-3 months and over the first-year post-transplantation. There was also a negative correlation between the 12-month cv and average MMF dose over the first three post-transplant months and over the first post-transplant year.
| Variables | Arterial fibrointimal thickening | P-value |
|---|---|---|
| Recipient gender (m. Vs. f.) | 0.48 ± 0.92 vs. 0.45 ± 0.87 | 0.829 |
| Donor gender (m. vs. f.) | 0.42 ± 0.88 vs. 0.55 ± 0.94 | 0.357 |
| DGF (yes vs. no) | 0.83 ± 1.17 vs. 0.26 ± 0.63 | 0 |
| Acute rejection (yes vs. no) | 0.54 ± 0.89 vs. 0.44 ± 0.92 | 0.527 |
| Steroid-free (yes vs. no) | 0.31 ± 0.73 vs. 0.58 ± 0.99 | 0.058 |
| Variables | R | P-value |
| Recipient age | 0.172 | 0.028 |
| Donor age | 0.285 | <0.001 |
| Total HLA mismatch | -0.023 | 0.774 |
| HLA DR missmatch | -0.077 | 0.332 |
| PRA | 0.05 | 0.539 |
| Implantation scores | ||
| arterial fibrointimal thickening | 0.162 | 0.04 |
| arteriolar hyalinosis | 0.396 | <0.001 |
| interstitial fibrosis | 0.175 | 0.026 |
| tubule atrophy | 0.168 | 0.032 |
| 12-month scores | ||
| arteriolar hyalinosis | 0.399 | <0.001 |
| interstitial fibrosis | 0.359 | <0.001 |
| tubule atrophy | 0.348 | <0.001 |
| total inflammation | 0.351 | <0.001 |
| Average tacrolimus concentration during first three months | -0.226 | 0.004 |
| Average tacrolimus concentration during first year | -0.196 | 0.014 |
| Average MMF dose during first three months |
-0.276 | <0.001 |
| Average MMF dose during first year | -0.287 | <0.001 |
Table 5: Association of various variables with the arterial fibrointimal thickening score (cv) at 12 months after transplantation.
In a multivariate analysis, the only association of cv score at 12 months remained with the ah score at implantation and with average MMF dose during first post-transplant year (Table 6).
| Effect | Β | -95% Cnf.Lmt | +95% Cnf.Lmt | P-value |
|---|---|---|---|---|
| Recipient age | 0.003 | -0.146 | 0.152 | 0.971 |
| Donor age | 0.088 | -0.072 | 0.248 | 0.278 |
| Tubule atrophy at implant. | 0.073 | -0.079 | 0.224 | 0.343 |
| Arterial fibrointimal thickening at implant. |
-0.073 | -0.232 | 0.086 | 0.367 |
| Arteriolar hyalinosis at implant. |
0.354 | 0.179 | 0.529 | 0 |
| Average MMF dose in 1st year |
-0.242 | -0.388 | -0.095 | 0.001 |
| Average tacrolimus concentration in 1st year |
-0.048 | -0.196 | 0.101 | 0.525 |
| DGF | 0.182 | -0.004 | 0.368 | 0.055 |
| Steroid free | -0.061 | -0.24 | 0.119 | 0.506 |
Table 6: Multivariate analysis of variables associated with arterial fibrointimal thickening (cv) at 12 months post-transplant.
Progression of cv score (Δcv) during the first post-transplant year was positively associated in univariate analyses with recipient age, donor age and occurrence of DGF. It was negatively associated with basal cv score, as well as with average first year MMF dose. The relationship between MMF dose and tacrolimus concentration during first year after transplantation and Δcv is shown in Figure 3A. Δcv was not associated with steroid-free immunosuppression, HLA mismatch, or with PRA.
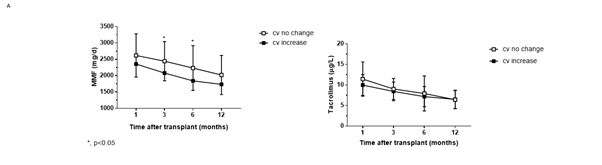
Figure 3A: Change in arterial fibrointimal thickening (Δcv) during the first post-transplant year with respect to MMF dose (a) and tacrolimus concentration (b) cv increase=closed squares; no change=open squares. Note: Only patients whose implantation cv, or ah score was <2 were included.
Factors associated with the ah score at 12 months post-transplant, or with its progression during first post-transplant year.
In univariate analysis, ah score at 12 months (Table 7) was in a positive correlation with recipient and donor age and borderline with the HLA-DR mismatch. 12-month ah score was not associated with PRA or with history of acute rejection in the first year. However, it was higher in patients who experienced DGF and who were on steroid maintenance immunosuppression. 12-month ah score was in a positive correlation with all implantations and 12-month chronic scores. There was a borderline negative correlation of the 12-month ah score with MMF dose at three months, average MMF dose at 1 and 3 months, as well as with average MMF dose during first post-transplant year. 12-month ah score negatively correlated with tacrolimus concentration at 1 and 3 months, with average concentration of tacrolimus at 1 and 3 months, as well as with average concentration of tacrolimus during first post-transplant year.
| Variables | arteriolar hyalinosis | P-value |
|---|---|---|
| Recipient gender (m. Vs. f.) | 1.11 ± 1.15 vs. 1.20 ± 1.17 | 0.619 |
| Donor gender (m. vs. f.) | 1.08 ± 1.16 vs. 1.21 ± 1.17 | 0.491 |
| DGF (yes vs. no) | 1.58 ± 1.21 vs. 0.87 ± 1.04 | <0.001 |
| Acute rejection (yes vs. no) | 1.22 ± 1.13 vs. 1.10 ± 1.17 | 0.534 |
| Steroid-free (yes vs. no) | 0.82 ± 1.01 vs. 1.35 ± 1.20 | 0.004 |
| Variables | R | P-value |
| Recipient age | 0.141 | 0.072 |
| Donor age | 0.396 | 0 |
| Total HLA mismatch | -0.081 | 0.306 |
| HLA DR missmatch | -0.135 | 0.088 |
| PRA | 0.132 | 0.106 |
| Implantation scores | ||
| arterial fibrointimal thickening | 0.237 | 0.002 |
| arteriolar hyalinosis | 0.518 | <0.001 |
| interstitial fibrosis | 0.175 | 0.026 |
| tubule atrophy | 0.179 | 0.022 |
| 12-month scores | ||
| arterial fibrointimal thickening | 0.399 | <0.001 |
| interstitial fibrosis | 0.366 | <0.001 |
| tubule atrophy | 0.394 | <0.001 |
| total inflammation | 0.253 | 0.001 |
| Average tacrolimus concentration during first three months | -0.24 | 0.002 |
| Average tacrolimus concentration during first year | -0.179 | 0.025 |
| Average MMF dose during first three months |
-0.143 | 0.07 |
| Average MMF dose during first year | -0.154 | 0.051 |
Table 7: Association of various variables with the arteriolar hyalinosis score (ah) at 12 months after transplantation.
However, in a multivariate analysis, 12-month ah score was independently associated only with donor age and basal ah score (Table 8).
| Effect | β | -95% Cnf.Lmt | +95% Cnf.Lmt | P-value |
|---|---|---|---|---|
| Recipient age | -0.061 | -0.202 | 0.08 | 0.393 |
| Donor age | 0.228 | 0.077 | 0.38 | 0.003 |
| Average MMF dose in 1st year |
-0.089 | -0.228 | 0.05 | 0.21 |
| Average tacrolimus concentration in 1st year |
-0.03 | -0.171 | 0.111 | 0.675 |
| Arteriolar hyalinosis at implantation |
0.436 | 0.27 | 0.601 | 0 |
| Arterial fibrointimal thickening at implantation |
-0.064 | -0.214 | 0.087 | 0.402 |
| Tubule atrophy at implantation | -0.005 | -0.149 | 0.138 | 0.94 |
| DGF | 0.095 | -0.081 | 0.271 | 0.288 |
| Steroid free | 0.11 | -0.06 | 0.28 | 0.204 |
Table 8: Multivariate analysis of variables associated with arteriolar hyalinosis (ah) at 12 months post-transplant.
First-year progression of ah score (Δah) was more likely with increased donor age and with lower basal ah score. Δah was not associated with steroid-free immunosuppression, DGF, HLA mismatch, or with PRA. It was also not associated with tacrolimus concentration, or MMF dose during first post transplant year Figure 3B.
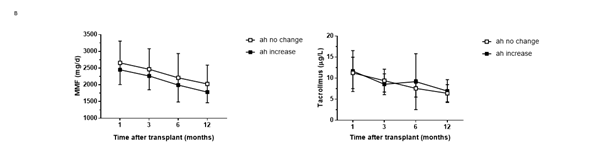
Figure 3B: Change in arteriolar hyalinosis (Δah) during the first post-transplant year with respect to MMF dose (a) and tacrolimus concentra tion. (b) ah increase=closed squares; no change=open squares. Note: Only patients whose implantation cv, or ah score was <2 were included.
DISCUSSION
In the present study, we analysed an association of chronic renal allograft vascular injury with renal function up to three years after transplantation, in a contemporary cohort of kidney, or kidney-pancreas transplant recipients from a single centre. We also explored an interaction of maintenance immunosuppression with the progression of chronic vascular scores. We have found that chronic arterial thickening assessed on a 12-month protocol biopsy and its progression during the first post-transplant year independently correlated with renal function up to three years post-transplant. Another finding is that more intense mycophenolate dosing during first post-transplant year is associated with lower 12-month cv score. Tacrolimus exposure was not related to progression of vascular chronic scores. To our knowledge, the present study is the first one that addressed progression of chronic vascular changes with respect to MMF dose.
Importance of chronic vascular injury for prediction of renal allograft function is controversial. Some studies did not find an association between chronic allograft vascular histology and 1-year renal function [2,3], while other did [8,4]. Unfortunately, studies on association of histology with renal allograft function were frequently based on now outdated immunosuppression protocols and often lack multivariate analysis. Nevertheless, most recently Nankivell's group reported a high frequency of new-onset arteriolar hyalinosis and arterial thickening in protocol biopsies in both cyclosporine- and tacrolimus-treated simultaneous kidney and pancreas transplant patients [5]. Both cv and ah scores were lower in tacrolimus- vs. cyclosporine treated recipients. These vascular lesions were progressive over years and there was a negative correlation between measured GFR and cv and ah scores in both univariate and multivariate analysis [4]. However, that study addressed chronic histology changes only with respect to the type of a calcineurin inhibitor in a multivariate analysis, because of a high collinearity of MMF with tacrolimus use at their center. In addition, MMF dose was not reported [5]. Therefore, it is tempting to speculate that lower degree of arteriolar hyalinosis and arterial thickening in tacrolimus-treated patients also might have resulted at least in part from MMF vs. azathioprine treatment. That would be in line with a previous study by the same group that reported diminished arteriolar hyalinosis with MMF vs. azathioprine in cyclosporine-treated patients, regardless of history of acute rejection [9]. Unfortunately, in that study chronic arterial f ibrointimal thickening was not reported. Our results differ to some extent from the Australian study [5] in that we did not observe an independent correlation between eGFR and ah score in a multivariate analysis, after other histology scores were taken into account. However, there are some differences between the two studies, such as a younger donor age, pristine baseline donor histology, higher tacrolimus concentration over the first post-transplant year, as well as longer patient follow-up in the Australian study [5].
Chronic renal allograft damage is frequently the result of a previous, or current alloimmune response [10,11] and cv score may be a consequence of either T cell-mediated or antibody mediated rejection. In a recent paper by Wiebe et al. [12], a previous T cell-mediated acute rejection and time after transplant were associated with an increased risk for cv ≥ 1 in a multivariate analysis. Appearance of dnDSA, while being associated with diagnosis of transplant glomerulopathy, was not associated with an increased cv score.
The mechanism by which more intense MMF dosing may have contributed to a decreased progression of renal vascular injury in the present study is unclear, as we did not observe decreased incidence of acute rejection with more intense MMF dosing. In addition, progression of cv was not associated with the history of acute rejection in our study. This seems to be in line with a previous publication [9] that reported that MMF was associated with lower ah scores vs. azathioprine, regardless of acute rejection, in cyclosporine-treated patients. In support, MMF was reported to have direct antiproliferative effects on various cell types, including fibroblasts and vascular smooth muscle cells [13-15]. In addition, there is some evidence of a direct effect of mycophenolic acid on suppression of vascular endothelial cell inducible nitric oxide synthase-mediated nitric oxide production, which may mediate vascular protective effects of MMF, as well [16].
We reported in a previous study a correlation between more intense dosing of MMF and decreased progression of interstitial f ibrosis and tubule atrophy, together with an improved renal function in a smaller cohort of kidney transplant recipients, treated with either cyclosporine or tacrolimus in combination with MMF [17]. Observed association of MMF with decreased 12-month ci and ct scores in that study may have been more pronounced in cyclosporine-treated patients, because in the present, low-dose tacrolimus-treated cohort we were able to demonstrate a strong, negative correlation between MMF dose and interstitial fibrosis and tubule atrophy only in univariate analysis (data not shown).
Chronic renal allograft histological injury is associated with inferior long-term graft outcome, especially if there is presence of active rejection, in particular antibody-mediated one [11,18,19]. Some other studies also reported an association between vascular changes and long-term graft survival [8,20]. Our study was not powered enough to evaluate association of chronic vascular changes, and their interaction with immunosuppression with death-censored graft loss in the period between 1 and 3 years post-transplant, because of a low event rate in the present cohort (3-year death-censored graft survival of 97%).
Although it is quite convincing that renal function would be lower in patients with chronic allograft injury, the rate of subsequent GFR decline may not be different in recipients with different renal function, as shown from a UK registry analysis [21]. Nevertheless, even if long-term renal function decline trajectories were parallel in patients with different baseline GFRs, those with lower GFRs would reach allograft failure sooner, as demonstrated from an analysis of the PORT study [22]. According to our results, more intense MMF dosing may retard progression of renal allograft arteriopathy, potentially leading to a better long-term graft function and survival. However, much longer follow-up than three years would be required to demonstrate such effect of MMF. In line with this, recent report on a 15-year follow-up of the subset of patients from Australia and New Zealand participating in the Tricontinental study, described a better death-censored graft survival in the 3 g/d vs. 2 g/d MMF group in combination with cyclosporine A [23]. Although there is no such data from prospective randomized controlled trials on the long-term outcome in tacrolimus-treated patients with respect to MMF dose, a pooled analysis of the relationship of tacrolimus exposure and mycophenolate mofetil dose reported a better 1-year graft function with more intense MMF dosing and with lower exposure to tacrolimus [24].
The shortcomings of our study, besides being a single centre, include its retrospective nature and limited follow-up time. In addition, the study was not powered to detect the relationship between chronic graft histology scores and graft survival. We did not analyse frequency of donor-specific antibodies during f irst three post-transplant years in the present cohort, as by the time majority of patients completed three-year observation, regular post-transplant surveillance in patients without graft dysfunction for donor-specific antibodies was not performed at our centre. However, renal biopsy and testing for donor-specific antibodies was performed in all cases of graft dysfunction. There was no formal monitoring of exposure to mycophenolic acid, as well.
CONCLUSION
In conclusion, our results suggest an independent association of arterial thickening with long-term kidney allograft function. More intense MMF dosing during first post-transplant year may be associated with a lower degree of chronic arterial injury.
AUTHOR CONTRIBUTIONS
Bojana Maksimovic- study design, data collection
Karlo Mihovilovic- data collection and analysis, manuscript writing
Petar Šenjug- data analysis and manuscript writing
Stela Bulimbašic- data collection
Danica Galešic Ljubanovic- data collection
Mladen Knotek- study design, data analysis, manuscript writing.
FUNDING SOURCE
Publication has been accomplished with financial support from John and Brit Wennerströms science foundation. Data originate from the routine clinical work.
REFRENCES
- Stegall MD, Gaston RS, Cosio FG, Matas A. Through a glass darkly: Seeking clarity in preventing late kidney transplant failure. J Am Soc Nephrol. 2015;26(1):20-29.
[Google Scholar] [PubMed] [Crossref]
- Anglicheau D, Loupy A, Lefaucheur C, Pessione F, Létourneau I, Côté I, et al. A simple clinico-histopathological composite scoring system is highly predictive of graft outcomes in marginal donors. Am J Transplant. 2008;8(11):2325-2334. 2008;8:2325-2334.
[Google Scholar] [PubMed] [Crossref]
- Randhawa PS, Minervini MI, Lombardero M, Duquesnoy R, Fung J, Shapiro R, et al. Biopsy of marginal donor kidneys: Correlation of histologic findings with graft dysfunction1. Transplantation. 2000;69(7):1352-1357.
[Google Scholar] [PubMed] [Crossref]
- Nankivell BJ, P'Ng CH, O'Connell PJ, Chapman JR. Calcineurin inhibitor nephrotoxicity through the lens of longitudinal histology: Comparison of cyclosporine and tacrolimus eras. Transplantation. 2016;100(8):1723-1731.
[Google Scholar] [PubMed] [Crossref]
- Sis B, Mengel M, Haas M, Colvin RB, Halloran PF, Racusen LC, et al. Banff’09 meeting report: Antibody mediated graft deterioration and implementation of Banff working groups. Am J Transplant. 2010;10(3):464-471.
[Google Scholar] [PubMed] [Crossref]
- Haas M, Sis B, Racusen LC, Solez K, Glotz D, Colvin RB, et al. Banff 2013 meeting report: Inclusion of c4d‐negative antibody‐mediated rejection and antibody‐associated arterial lesions. Am J Transplant;14(2):272-283.
[Google Scholar] [PubMed] [Crossref]
- Buron F, Hadj-Aissa A, Dubourg L, Morelon E, Steghens JP, Ducher M, et al. Estimating glomerular filtration rate in kidney transplant recipients: Performance over time of four creatinine-based formulas. Transplantation. 2011;92(9):1005-1011.
[Google Scholar] [PubMed] [Crossref]
- Karpinski J, Lajoie G, Cattran D, Fenton S, Zaltzman J, Cardella C, et al. Outcome of kidney transplantation from high-risk donors is determined by both structure and function. Transplantation. 1999;67(8):1162-1167.
[Google Scholar] [PubMed] [Crossref]
- Nankivell BJ, Wavamunno MD, Borrows RJ, Vitalone M, Fung CL, Allen RD, et al. Mycophenolate mofetil is associated with altered expression of chronic renal transplant histology. Am J Transplant. 2007;7(2):366-376.
[Google Scholar] [PubMed] [Crossref]
- Modena BD, Kurian SM, Gaber LW, Waalen J, Su AI, Gelbart T, et al. Gene expression in biopsies of acute rejection and interstitial fibrosis/tubular atrophy reveals highly shared mechanisms that correlate with worse long‐term outcomes. Am J Transplant. 2016;16(7):1982-1998.
[Google Scholar] [PubMed] [Crossref]
- Naesens M, Kuypers DR, De Vusser K, Evenepoel P, Claes K, Bammens B, et al. The histology of kidney transplant failure: A long-term follow-up study. Transplantation. 2014;98(4):427-435.
[Google Scholar] [PubMed] [Crossref]
- Wiebe C, Gibson IW, Blydt-Hansen TD, Pochinco D, Birk PE, Ho J, et al. Rates and determinants of progression to graft failure in kidney allograft recipients with de novo donor-specific antibody. Am J Transplant. 2015;15(11):2921-2930.
[Google Scholar] [PubMed] [Crossref]
- Shimizu H, Takahashi M, Takeda SI, Inoue S, Fujishiro J, Hakamata Y, et al. Mycophenolate mofetil prevents transplant arteriosclerosis by direct inhibition of vascular smooth muscle cell proliferation. Transplantation. 2004;77(11):1661-1667.
[Google Scholar] [PubMed] [Crossref]
- Petrova DT, Brandhorst G, Brehmer F, Gross O, Oellerich M, Armstrong VW. Mycophenolic acid displays IMPDH-dependent and IMPDH-independent effects on renal fibroblast proliferation and function. Ther Drug Monit. 2010;32(4):405-412.
[Google Scholar] [PubMed] [Crossref]
- Copeland JW, Beaumont BW, Merrilees MJ, Pilmore HL. Epithelial-to-mesenchymal transition of human proximal tubular epithelial cells: Effects of rapamycin, mycophenolate, cyclosporin, azathioprine, and methylprednisolone. Transplantation. 2007;83(6):809-814.
[Google Scholar] [PubMed] [Crossref]
- Senda M, DeLustro B, Eugui E, Natsumeda Y. Mycophenolic acid, an inhibitor of IMP dehydrogenase that is also an immunosuppressive agent, suppresses the cytokine-induced nitric oxide production in mouse and rat vascular endothelial cells. Transplantation. 1995;60(10):1143-1148.
[Google Scholar] [PubMed] [Crossref]
- Mihovilović K, Maksimović B, Kocman B, Guštin D, Vidas Ž, Bulimbašić S, et al. Effect of mycophenolate mofetil on progression of interstitial fibrosis and tubular atrophy after kidney transplantation: A retrospective study. BMJ open. 2014;4(7):e005005.
[Google Scholar] [PubMed] [Crossref]
- Naesens M, Kuypers DR, De Vusser K, Vanrenterghem Y, Evenepoel P, Claes K, et al. Chronic histological damage in early indication biopsies is an independent risk factor for late renal allograft failure. Am J Transplant. 2013;13(1):86-99.
[Google Scholar] [PubMed] [Crossref]
- Matas AJ, Leduc R, Rush D, Cecka JM, Connett J, Fieberg A, et al. Histopathologic clusters differentiate subgroups within the nonspecific diagnoses of CAN or CR: Preliminary data from the DeKAF study. Am J Transplant. 2010;10(2):315-323.
[Google Scholar] [PubMed] [Crossref]
- Munivenkatappa RB, Schweitzer EJ, Papadimitriou JC, Drachenberg CB, Thom KA, Perencevich EN, et al. The Maryland aggregate pathology index: A deceased donor kidney biopsy scoring system for predicting graft failure. Am J Transplant. 2008;8(11):2316-2324.
[Google Scholar] [PubMed] [Crossref]
- Udayaraj UP, Casula A, Ansell D, Dudley CR, Ravanan R. Chronic kidney disease in kidney transplant recipients-is it different from chronic native kidney disease?. Transplantation. 2010;90(7):765-770.
[Google Scholar] [PubMed] [Crossref]
- Kasiske BL, Israni AK, Snyder JJ, Skeans MA, Patient Outcomes in Renal Transplantation (PORT) Investigators. The relationship between kidney function and long-term graft survival after kidney transplant. Am J Kidney Dis. 2011;57(3):466-475.
- Clayton PA, McDonald SP, Chapman JR, Chadban SJ. Mycophenolate versus azathioprine for kidney transplantation: A 15-year follow-up of a randomized trial. Transplantation. 2012;94(2):152-158.
[Google Scholar] [PubMed] [Crossref]
- Ekberg H, Van Gelder T, Kaplan B, Bernasconi C. Relationship of tacrolimus exposure and mycophenolate mofetil dose with renal function after renal transplantation. Transplantation. 2011;92(1):82-87.
[Google Scholar] [PubMed] [Crossref]
Author(s) Info
1 Renal Division, Department of Medicine, University Hospital Merkur, Zagreb, Croatia (Hrvatska)2 Department of Nephrology, Sahlgrenska University Hospital, Gothenburg, Sweden
3 Department of Pathology, University Hospital Dubrava, Zagreb, Croatia (Hrvatska)
4 Department of Pathology, University Hospital Centre, Zagreb, Croatia (Hrvatska)
5 University of Zagreb Medical School, Zagreb, Croatia (Hrvatska)
Received date: 19-Nov-2025, Manuscript No: JNP-25-165655; Editor Assigned: 21-Nov-2025 Reviewed: 05-Dec-2025 Revised: 12-Dec-2025 Accepted date: 16-Dec-2025 Published date: 19-Dec-2025
Citation: Maksimovic B, Mihovilovic K, Šenjug P, Bulimbašic S, Ljubanovic DG, Knotek M. (2025) Association of Chronic Vascular Injury with Long Term Renal Allograft Function and Mycophenolate Dose- a Single-Center Retrospective Study. J Nephrol.1:11.
Copyright: © 2025 Maksimovic B, et al. This is an open-access article distributed under the terms of the Creative Commons Attribution License, which permits unrestricted use, distribution, and reproduction in any medium, provided the original author and source are credited.
