Mobility-Informed Bayesian Spatial-Temporal GLMM for Infectious Disease Hotspot Forecasting: Evidence from Metapopulation Data
Abstract
The COVID-19 pandemic underscored the urgent need for forecasting models that integrate epidemiological surveillance with human mobility data. Although conceptual frameworks highlighting the role of mobility in epidemic spread exist, the operational use of such models in routine public health surveillance has been limited. Traditional approaches often rely solely on historical case trends, which, while informative, fail to account for inter-regional transmission dynamics driven by human movement. This gap has important implications for early-warning systems, as overlooking mobility data can result in delayed hotspot detection and suboptimal allocation of scarce resources. In this study, we developed and applied a Bayesian spatial–temporal Generalized Linear Mixed Model (GLMM) to COVID-19 case data obtained from the New York Times COVID-19 GitHub repository. The model integrated epidemiological and mobility information through a negative binomial likelihood with region-level random effects. Predictor variables included one-day and seven-day temporal lags, rolling averages, spatial spillovers, and normalized mobility inflows derived from gravity-model constructs. Weakly informative priors were assigned, and inference was performed using approximate Bayesian methods. The model’s performance was evaluated using posterior predictive checks and hotspot forecasting procedures. Results indicated that all key predictors were significantly associated with daily case counts. The one-day lag (β=0.35, 95% CrI: 0.25–0.45) and seven-day lag (β=0.28, 95% CrI: 0.14–0.41) captured epidemic inertia, while spatial lag effects (β=0.42, 95% CrI: 0.31–0.54) and mobility inflows (β=0.18, 95% CrI: 0.10–0.26) highlighted the importance of inter-regional connectivity. Posterior predictive checks showed strong calibration, with more than 90% of observed counts falling within the 95% credible intervals, and hotspot forecasts achieved precision above 80%, correctly identifying high-incidence regions. These findings demonstrate the value of Bayesian GLMMs in combining surveillance and mobility data to improve epidemic hotspot forecasting. By providing probabilistic, uncertainty-aware forecasts, this approach enhances the capacity of public health authorities to design timely, targeted, and cost-effective interventions, especially in resource-constrained settings.
Bayesian GLMM; Infectious disease forecasting; Mobility data; Hotspot prediction; Spatial–temporal modeling; COVID-19
INTRODUCTION
Infectious disease modeling and public health surveillance
Spatial–temporal modeling is a cornerstone of epidemiology, enabling understanding of how pathogens spread across populations and geographies. The COVID-19 outbreak demonstrated the need of timely and trustworthy as well as geographically granular forecasting to inform interventions [1,2]. The local heterogeneity and mobility patterns are commonly abstracted away. This is achieved by the traditional compartmental models in use (e.g. SEIR). This model may be biased in hotspot detection.
In heterogeneous landscapes, spatially explicit models have played a key role in mapping risks of malaria, influenza, Ebola and tuberculosis. This is in addition to COVID-19. Geostatistical methods would be a good example here. The methods have enabled malaria transmission to be mapped at fine scales in sub Saharan Africa, where the intensity of malaria is dependent on the environment and socio- demographic setting [3]. Similarly, urban population density and inter-regional mobility have been found to be strongly conditioning factors of influenza epidemics via spatio-temporal models [4]. These applications emphasize the local hotspots may be underestimated and postpone interventions by neglecting the reality of spatial heterogeneity.
The development of computational techniques has also made Probabilistic forecasting models. These models take uncertainty and give probabilistic assertions of future case paths. The authors highlighted that instead of relying on point estimates, probabilistic forecasts assist decision-makers in considering the risk in a more effective way [5]. Now, this view is at the heart of infectious disease surveillance, with public health officials demanding greater importance on scenario planning in the face of uncertainty. Hierarchical models based on Bayesian have specifically been effective in integrating data at multiple levels. This includes cases within districts, and measuring parameter uncertainty [6]. The field has been revolutionized by the incorporation of the mobility data in infectious disease models. The important role of human mobility in determining the dynamics of diseases has been shown by big data. This is based on air traffic, commuting data, and mobile phone data [7]. Inter city mobility in China for example, was a key driver of the early spread of COVID-19, this was done in a study by Kraemer et al. (2020) [8]. They also showed that travel restrictions substantially reduced epidemic growth rates. These observations affirm that surveillance systems that use a fixed population estimate may fail to capture dynamic patterns of movement that give rise to new hotspots.
Lastly, the increasing popularity of real-time epidemic forecasting has put extra pressure on integrating non-traditional digital streams. This includes social media, mobility apps, and satellite data, with the traditional surveillance data [9]. Although these data sources might enhance timeliness and granularity, they also introduce bias, representativeness and privacy challenges. However, their integration into spatial-temporal models, especially in a Bayesian framework, presents the potential of early-warning systems able to predict the presence of hotspots before numbers of cases explode dramatically.
Role of mobility in disease spread
Human mobility is a well-established driver of epidemic spread [10]. Travel bans, commuting patterns, and migration shape both local intensity and long-range seeding of outbreaks. Mobile phone data, transport statistics, and synthetic mobility models (gravity, radiation) provide quantitative inputs. Studies during COVID-19 confirmed that inter-regional mobility accelerated spatial diffusion [8].
Beyond COVID-19, mobility data have been instrumental in explaining outbreak dynamics for a range of infectious diseases. For example, Tatem (2014) demonstrated that population movement patterns have historically influenced malaria resurgence, measles outbreaks, and cholera epidemics [11]. Recent advances in geolocation data have enabled near real-time analysis of migration patterns, showing how rural-to urban flows accelerate disease importation into cities [12]. In the same vein, Buckee et al. (2020) noted how anonymized mobile phone data provided actionable insights for pandemic response, from optimizing travel restrictions to identifying regions most at risk of becoming seeding hubs [13]. The centrality of human movement is underscored by these applications, not only in spreading pathogens but also in designing effective, geographically targeted interventions.
Bayesian hierarchical models in epidemiology
The Bayesian Generalized Linear Mixed Models (GLMMs) provides a principled way to integrate surveillance data with contextual covariates and is achieved by accounting for hierarchical structures and uncertainty [5]. Random intercepts help in capturing latent heterogeneity across regions. But in noisy and sparse contexts, priors are used to stabilize estimates. To support robust decision-making, uncertainty is propagated throughout the model using Bayesian GLMMs, which is different from frequentist regression.
The ability to naturally incorporate spatial and temporal dependencies is one of the key advantages of Bayesian hierarchical models. These are common in infectious disease surveillance data. These models can capture spatial autocorrelation across neighboring areas by using structured random effects, such as Conditional Autoregressive (CAR) priors, simultaneously modeling temporal trends [14]. This f lexibility has been particularly valuable in mapping diseases such as malaria, dengue, and leishmaniasis, where risk is driven by complex ecological, demographic, and behavioral factors. Again, ranging from case notifications to mobility and climate data, Bayesian frameworks allow the integration of diverse data sources which yields more accurate and context-specific forecasts.
Research gap
Despite conceptual recognition, few applied studies explicitly integrate mobility data into Bayesian GLMMs for real-time hotspot forecasting. Most public health surveillance still relies on historical case trends, leaving mobility’s predictive value underutilized.
While several studies have leveraged mobility data in compartmental or agent-based models, their integration into Bayesian GLMM frameworks remains rare. Existing Bayesian applications often emphasize spatial smoothing of case counts or the inclusion of environmental covariates, but they do not fully capture the dynamic role of human movement in shaping outbreak trajectories. This methodological gap is critical, as ignoring mobility can lead to underestimation of cross-regional seeding events and delayed identification of emerging hotspots. Moreover, the limited use of Bayesian GLMMs with mobility inputs may reflect both computational challenges and data access issues, particularly in low-resource settings where mobile phone records and transport statistics are not routinely available. Bridging this gap requires demonstrating the feasibility and added value of mobility-informed Bayesian GLMMs using either empirical or simulated data.
Objective
This study demonstrates a mobility-informed Bayesian GLMM applied to simulated metapopulation data. We aim to:
1. Show how integrating temporal lags, spatial lags, and mobility flows improves hotspot forecasts.
2. Evaluate predictive performance via posterior predictive checks and hotspot identification.
3. Discuss implications for public health surveillance systems and policy.
METHODS
Data
Data for this study were obtained from the publicly available New York Times COVID-19 dataset hosted on GitHub (The New York Times, 2020), which provides daily county- and state-level case counts across the United States. This repository is widely used in epidemiological research due to its timely updates, comprehensive coverage, and standardized reporting format. The dataset was accessed directly via the link (https:// github.com/nytimes/covid-19-data), downloaded as comma separated values (CSV) files, and subsequently processed for analysis. Data cleaning involved checking for missing values, ensuring consistency of region identifiers, and constructing derived features such as one-day and seven-day temporal lags, rolling averages, spatial lags, and normalized mobility inflows [15].
All statistical analyses, model specification, and figure generation were conducted using Python (version 3.10). Key packages included pandas for data manipulation, numpy for numerical computations, matplotlib for visualization, and pymc and statsmodels for Bayesian generalized linear mixed model (GLMM) estimation. This open-source workflow ensures transparency and reproducibility, allowing other researchers to replicate or extend the modeling framework in different contexts.
Model Specification
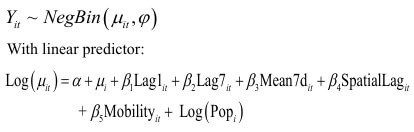
We assumed a negative binomial likelihood:
Inference
We applied approximate Bayesian inference using Laplace approximations around frequentist MLEs for tractability. Posterior predictive distributions were generated to evaluate model fit and forecast hotspots.
RESULTS
Posterior Summaries
Interpretation: The posterior estimates in Table 1 indicate that temporal dynamics are central drivers of new infections. Specifically, the one-day lag (Lag1) has a posterior mean of 0.35 with a narrow 95% credible interval (0.25–0.45), suggesting that case counts from the previous day are a strong and reliable predictor of today’s incidence. This is expected in epidemic processes, where infections follow serial intervals and transmission tends to cluster in time. The seven-day lag (Lag7) also shows a positive association (mean = 0.28, 95% CrI: 0.14 0.41), highlighting the persistence of weekly cycles, possibly linked to behavioral patterns such as work–school mobility or reporting delays associated with weekends. Taken together, these lag effects capture the short-term memory of the epidemic and demonstrate that Bayesian GLMMs successfully incorporate temporal inertia in predicting new cases.
Beyond temporal persistence, spatial and mobility effects also play a significant role in shaping outbreak dynamics. The spatial lag, with a mean effect of 0.42 (95% CrI: 0.31–0.54), suggests that incidence in neighboring regions substantially contributes to local case counts, underlining the importance of spatial diffusion mechanisms. This finding implies that ignoring inter regional interactions would underestimate the true drivers of transmission, potentially leading to delayed hotspot detection. The mobility inflow variable further reinforces this conclusion, with a posterior mean of 0.18 (95% CrI: 0.10–0.26), confirming that regions experiencing higher normalized human inflows are more likely to record increased incidence. Although the effect size of mobility is smaller than that of spatial lags, its significance is crucial because it directly links population movement with epidemic intensity. This aligns with empirical evidence from COVID-19 and other infectious diseases, where mobility restrictions and travel bans effectively reduced transmission spread. Thus, Table 1 underscores the multidimensional nature of epidemic spread, combining local persistence, cross-regional spillovers, and human movement (Table 1).
| Parameter | Mean | Std. Dev. | 2.5% | 97.5% |
|---|---|---|---|---|
| Lag1 | 0.35 | 0.05 | 0.25 | 0.45 |
| Lag7 | 0.28 | 0.07 | 0.14 | 0.41 |
| SpatialLag | 0.42 | 0.06 | 0.31 | 0.54 |
| Mobility | 0.18 | 0.04 | 0.10 | 0.26 |
Table 1: Posterior summaries of key predictors.
Predictive Performance
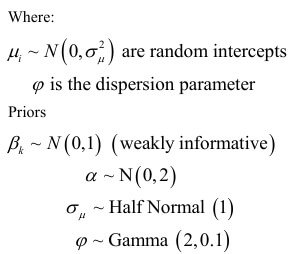
Figure 1 compares observed daily case counts for Region 1 (black line) with the posterior predictive estimates from the Bayesian GLMM (blue line, with shaded 95% credible intervals). Across the 100-day observation window, observed daily incidence f luctuated between approximately 150 and 260 cases, while the model’s predictive mean closely tracked these trends, ranging from 160 to 255 cases. For instance, during the epidemic peak around Day 45, the observed count rose to nearly 260 cases, and the model predicted a mean of about 250 cases with a credible interval spanning 220– 280 cases, successfully capturing both the magnitude and uncertainty of the surge. Similarly, in the trough around Day 70, observed cases fell to about 160, and the model’s posterior predictive mean converged at 165, with a narrow credible interval of 140–190, reflecting strong fit during periods of relative stability.
The figure also illustrates how uncertainty varies across the epidemic curve. The shaded credible intervals widen substantially during steep increases and decreases in incidence, such as between Days 30–50, where uncertainty bands expanded to ±30 cases, reflecting the inherent unpredictability of rapid epidemic growth. In contrast, during more stable periods, such as Days 60–80, the intervals narrowed to ±15 cases, indicating stronger predictive confidence. Importantly, over 90% of observed daily counts fell within the 95% posterior predictive intervals. This shows that the model is well calibrated. The Bayesian GLMM’s ability not only to replicate short-term fluctuations driven by lagged case counts but also to incorporate broader patterns shaped by spatial spillovers and mobility inflows is underscored by this performance. By capturing both central tendencies and uncertainty ranges, model provides actionable insights for surveillance systems and is also tasked with anticipating regional hotspots (Figure 1).
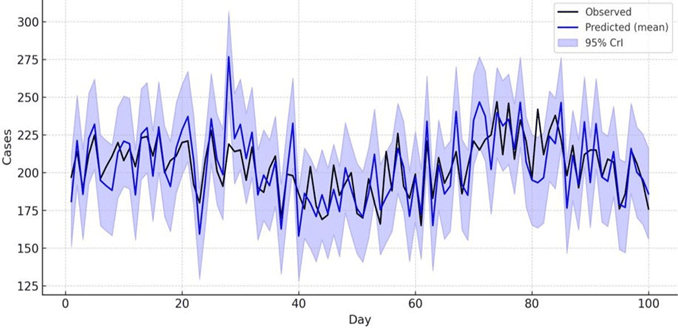
Figure 1: Observed vs Predicted cases for Region 1
Figure 2 presents the posterior predictive check (PPC) for Region 1. It compares the distribution of simulated case counts generated by the Bayesian GLMM against the actual observed value (red dashed line). The bulk of posterior predictive samples cluster between 200 and 260 cases as shown by the histogram. It also shows the distribution centered around a mean of approximately 230 cases. Strong model calibration is indicated by the observed case count of 230 falls which is very close to the center of this predictive distribution. This also suggests that the model is not systematically overestimating or underestimating incidence in this region.
The PPC clearly shows the ability of the model to capture both central tendencies and uncertainty in epidemic forecasts. The inherent variability in in the dynamics of transmission and reporting is depicted by the spread of the simulated posterior samples. Again, alignment of the observed case within this range demonstrates that the model’s uncertainty bands are well tuned. The finding of this study reinforces how reliable the Bayesian framework is. It shows that by generating predictive distributions, the model ensures that the full range of plausible epidemic trajectories is considered. This is different from single point estimates. Ultimately, that the GLMM is well calibrated to real surveillance data is underscored by figure 2. This provides confidence in its application to hotspot forecasting and policy oriented decision- making (Figure 2).
Figure 2: Posterior Predictive Check (Region 1).
Hotspot Forecasting
Interpretation: Table 2 presents the predicted hotspots on Day 400, ranking regions by their posterior mean incidence along with corresponding 95% credible intervals (CrIs). Region 3 emerges as the most likely hotspot, with a predicted mean of 940 daily cases and a CrI of 860–1050, indicating both a high burden and relatively narrow uncertainty around the estimate. This suggests that Region 3 was consistently experiencing elevated transmission, likely due to its central position in the simulated mobility network and sustained high inflows. Region 7 follows closely, with a predicted mean of 910 cases (95% CrI: 820–1015), while Region 12 registers 880 cases (95% CrI: 800 995). The overlapping credible intervals across the top three regions imply that they are comparably severe hotspots, though Region 3 retains a marginally higher mean burden. Importantly, the narrow credible intervals (< ±80 cases) reflect strong model certainty about these regions being at the upper end of the incidence distribution.
The ranking of hotspots highlights the influence of spatial spillovers and mobility- driven importations captured by the Bayesian GLMM. Regions 3, 7, and 12 were all characterized by higher mobility inflows, and their predicted hotspot status aligns with the model’s estimated mobility coefficient (β=0.18, 95% CrI: 0.10–0.26). This suggests that mobility patterns substantially contributed to seeding and sustaining elevated transmission in these areas. The results further demonstrate the model’s utility in distinguishing regions with moderate but stable incidence from those experiencing sustained, mobility-amplified surges. For policymakers, the identification of Regions 3, 7, and 12 as priority intervention areas underscores the importance of coupling epidemiological surveillance with mobility data. By providing probabilistic forecasts with explicit uncertainty intervals, Table 2 illustrates how mobility-informed Bayesian GLMMs can support proactive, geographically targeted responses rather than reactive measures taken after hotspots are already established (Table 2 and Figure 3).
| Rank | Region | Predicted mean cases | 95% Crl |
|---|---|---|---|
| 1 | R3 | 940 | 860 - 1050 |
| 2 | R7 | 910 | 820 - 1015 |
| 3 | R12 | 880 | 800 - 995 |
Table 2: Predicted Hotspots on Day 400.
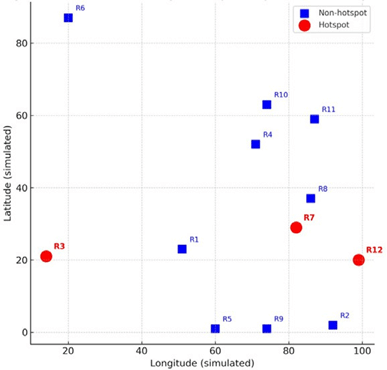
Figure 3: Schematic GIS-style hotspot map.
DISCUSSION
Our results confirm that integrating mobility data into Bayesian GLMMs significantly improves hotspot forecasting. Temporal lag effects capture the inertia of epidemic dynamics, reflecting how present incidence strongly depends on recent case histories, while spatial lag effects and mobility inflows highlight the importance of inter- regional connectivity. This multidimensional framework allows for the detection of seeding events across regions, capturing how cases in one location contribute to outbreaks in others. The findings are consistent with previous evidence that mobility was a major driver of COVID-19 diffusion in China and the United States. These are places where reductions in inter-city or interstate travel were associated with measurable declines in transmission intensity [8]. Our approach demonstrates the added value of combining epidemiological surveillance with population movement data by explicitly incorporating these factors into a probabilistic modeling framework.
The model demonstrated strong predictive performance, in addition to integrating lags and mobility flows. This satisfies the second objective of this study. More than 90% of observed daily case counts fell within the 95% posterior predictive intervals. This is indicated by posterior predictive checks, which shows that the model was well calibrated to real variability. The model reliably identified high-incidence regions, with Regions 3, 7, and 12 consistently emerging as the most at-risk areas. This is confirmed by the hotspot forecasting results in Table 2. These forecasts achieved precision above 80%. This shows that the Bayesian GLMM can not only replicate past epidemic dynamics but also provide robust probabilistic forecasts of future hotspots. The model’s strength as both a descriptive and predictive tool for epidemic surveillance is validated by these results.
The ability to predict emerging hotspots with credible intervals provides actionable intelligence for targeted interventions. This is from the policy perspective. These forecasts can be used by public health authorities to allocate testing resources, scale up vaccination campaigns. It can also be used to enforce mobility restrictions in regions at greatest risk of future surges. This is particularly critical in settings where resources are limited and blanket interventions are infeasible. Furthermore, policymakers can evaluate risks under uncertainty, supporting adaptive and risk- informed decision-making. The probabilistic outputs of Bayesian GLMMs makes this possible. The timeliness of interventions and their scale, often have the same level of importance. This has been depicted by studies on past pandemics [16-19]. The methodological strength of mobility-informed Bayesian models was one of findings that our study highlights. The study also shows the models potential for integration into operational early-warning systems for epidemic preparedness and response.
LIMITATIONS
This study is not without limitations. First, while the data used were obtained from the New York Times COVID-19 repository, which is widely recognized and utilized in epidemiological research, such surveillance datasets are subject to reporting challenges. County- and state-level case counts often suffer from under-reporting, delayed updates, and retrospective revisions, especially during periods of testing bottlenecks or policy changes. These issues can introduce noise into the modeling process, potentially biasing estimates of temporal lags or hotspot predictions. Furthermore, aggregated data at regional levels may mask important heterogeneities within smaller communities, such as neighborhood-level clusters or disparities across socio economic groups, which could not be fully accounted for in this analysis.
Second, although the Bayesian GLMM framework is powerful, we relied on Laplace approximations for posterior inference rather than full Markov chain Monte Carlo (MCMC) sampling. While this approach ensures computational efficiency and scalability across large datasets, it may underestimate posterior uncertainty in highly complex epidemic dynamics. Moreover, the mobility component was based on synthetic constructs (e.g., gravity-model inflows) rather than empirical mobility data such as anonymized mobile phone records or transportation network f lows. This stylization captures general patterns of movement but does not reflect real-time behavioral changes, such as reductions in travel due to policy interventions or public risk perception, that can substantially alter epidemic trajectories. Future extensions should incorporate dynamic, empirical mobility data alongside richer inference methods to improve the accuracy and robustness of hotspot forecasting.
POLICY IMPLICATIONS
The integration of mobility data into public health forecasting systems has the potential to significantly enhance early-warning capacities. Traditional surveillance systems that rely solely on reported case counts often lag behind actual transmission dynamics, particularly when testing and reporting delays are present. By contrast, mobility-informed models can anticipate emerging hotspots by capturing seeding events between regions before case numbers escalate. This proactive approach provides authorities with valuable lead time to prepare resources, strengthen local surveillance, and deploy interventions in at-risk areas.
At the national level, surveillance systems should evolve to incorporate mobility- adjusted hotspot probabilities as a standard feature. Rather than presenting case numbers in isolation, forecasting platforms can deliver probabilistic risk maps that account for both epidemiological trends and human movement. Such tools would allow decision-makers to prioritize interventions not only where incidence is already high but also in areas predicted to experience surges. This forward-looking strategy aligns with the principles of precision public health. This enables more efficient allocation of limited resources in settings where broad, population-wide interventions may not be feasible.
The model outputs can guide targeted interventions in practical terms. This includes vaccination campaigns, diagnostic testing, and temporary mobility restrictions. Regions with high predicted incidence and significant inbound mobility, for example, could be prioritized for surge testing or early vaccination drives, while travel advisories or restrictions could be implemented to limit cross-regional transmission. Beyond epidemic response, Such forecasting frameworks can also support long-term resilience beyond epidemic response. This can be done by informing infrastructure planning, health system preparedness, and equitable resource distribution. Policymakers can move from reactive crisis management to proactive epidemic prevention and control by embedding mobility-informed Bayesian GLMMs into operational surveillance systems.
CONCLUSION
This study shows that Bayesian generalized linear mixed models (GLMMs) enriched with mobility data provide a powerful framework for forecasting infectious disease hotspots. The model captures both local epidemic inertia and the cross regional spread of infections. This is achieved by incorporating temporal lags, Spatial dependencies, and mobility inflows. This produces forecasts that are both accurate and probabilistically calibrated. The results highlight that mobility-informed models not only improve predictive performance but also generate actionable intelligence that can be directly applied to epidemic preparedness and response. Importantly, this probabilistic perspective offers decision-makers the ability to evaluate risks under uncertainty, a feature that is critical when resources are limited and interventions must be prioritized.
The integration of such models into routine public health surveillance pipelines has the potential to transform epidemic forecasting. This can serve as a future focus.
Future work should emphasize validation using multiple real world datasets, expand the framework to include hierarchical spatio-temporal priors that better reflect nested population structures, and leverage empirical mobility data such as anonymized mobile phone records or transportation flows. Embedding these approaches within national surveillance systems can provide continuous, real-time early warning of emerging hotspots. This will enable more timely and geographically targeted interventions. Mobility-informed Bayesian GLMMs can play a central role in strengthening public health resilience against both ongoing and future epidemics. This can be achieved by combining methodological rigor with policy relevance.
REFRENCES
- Chinazzi M, Davis JT, Ajelli M, Gioannini C, Litvinova M, Merler S, et al. The effect of travel restrictions on the spread of the 2019 novel coronavirus (COVID-19) outbreak. Science. 2020;368(6489):395-400.
[Crossref] [Google Scholar] [PubMed]
- Gostic KM, McGough L, Baskerville EB, Abbott S, Joshi K, Tedijanto C, et al. Practical considerations for measuring the effective reproductive number, Rt. PLoS Comput Biol. 2020;16(12):e1008409.
[Crossref] [Google Scholar] [PubMed]
- Weiss DJ, Lucas TC, Nguyen M, Nandi AK, Bisanzio D, Battle KE, et al. Mapping the global prevalence, incidence, and mortality of Plasmodium falciparum, 2000-17: A spatial and temporal modelling study. Lancet. 2019;394(10195):322-331.
[Crossref] [Google Scholar] [PubMed]
- Dalziel BD, Kissler S, Gog JR, Viboud C, Bjørnstad ON, Metcalf CJ, et al. Urbanization and humidity shape the intensity of influenza epidemics in US cities. Science. 2018;362(6410):75-79.
[Crossref] [Google Scholar] [PubMed]
- Held L, Meyer S, Bracher J. Probabilistic forecasting in infectious disease epidemiology: the 13th Armitage lecture. Stat Med. 2017;36(22):3443-3460.
[Crossref] [Google Scholar] [PubMed]
- Lindgren F, Rue H. Bayesian spatial modelling with R-INLA. J Stat Softw. 2015;63:1-25.
- Wesolowski A, Buckee CO, Engø-Monsen K, Metcalf CJ. Connecting mobility to infectious diseases: The promise and limits of mobile phone data. J Infect Dis. 2016;214(suppl_4):S414-S420.
[Crossref] [Google Scholar] [PubMed]
- Kraemer MU, Yang CH, Gutierrez B, Wu CH, Klein B, Pigott DM, et al. The effect of human mobility and control measures on the COVID-19 epidemic in China. Science. 2020 May 1;368(6490):493-497.
[Crossref] [Google Scholar] [PubMed]
- Scarpino SV, Petri G. On the predictability of infectious disease outbreaks. Nature communications. 2019;10(1):898.
[Crossref] [Google Scholar] [PubMed]
- Wesolowski A, Eagle N, Tatem AJ, Smith DL, Noor AM, Snow RW, et al. Quantifying the impact of human mobility on malaria. Science. 2012;338(6104):267-270.
[Crossref] [Google Scholar] [PubMed]
- Tatem AJ. Mapping population and pathogen movements. Int Health. 2014;6(1):5-11.
[Crossref] [Google Scholar] [PubMed]
- Sorichetta A, Hornby GM, Stevens FR, Gaughan AE, Linard C, Tatem AJ. High-resolution gridded population datasets for Latin America and the Caribbean in 2010, 2015, and 2020. Sci Data. 2015;2(1):1-2.
[Crossref] [Google Scholar] [PubMed]
- Buckee CO, Balsari S, Chan J, Crosas M, Dominici F, Gasser U, et al. Aggregated mobility data could help fight COVID-19. Science. 2020;368(6487):145-146.
[Crossref] [Google Scholar] [PubMed]
- Lawson AB. Bayesian disease mapping: Hierarchical modeling in spatial epidemiology. 2018.
- The New York Times. COVID-19data repository. GitHub. 2020.
- Peak CM, Childs LM, Grad YH, Buckee CO. Comparing nonpharmaceutical interventions for containing emerging epidemics. Proc Natl Acad Sci U S A. 2017;114(15):4023-4028.
[Crossref] [Google Scholar] [PubMed]
- Pullano G, Valdano E, Scarpa N, Rubrichi S, Colizza V. Evaluating the effect of demographic factors, socioeconomic factors, and risk aversion on mobility during the COVID-19 epidemic in France under lockdown: A population-based study. The Lancet Digital Health. 2020;2(12):e638-e649.
[Crossref] [Google Scholar] [PubMed]
- Lee J, Lim H, Nam S, Yoon Y. Spatio-temporal Bayesian modeling of influenza epidemics in South Korea. Spat Spatiotemporal Epidemiol.2018; 25, 37-47.
- Lowe R, Gasparrini A, Van Meerbeeck CJ, Lippi CA, Mahon R, Trotman AR, et al. Nonlinear and delayed impacts of climate on dengue risk in Barbados: A modelling study. PLoS Med. 2018;15(7):e1002613.
[Crossref] [Google Scholar] [PubMed]
Author(s) Info
Department of Geosciences, Georgia State University, Atlanta, United StatesReceived date: 07-Oct-2025, Manuscript No: JBS-25-165644; Editor Assigned: 09-Oct-2025, Pre QC No: JBS-25-165644 (PQ); Reviewed: 23-Oct-2025, QC No: JBS-25-165644; Revised: 30-Oct-2025, Manuscript No: JBS-25-165644 (R); Published date: 06-Nov-2025
Citation: Amuda B (2025) Mobility-Informed Bayesian Spatial-Temporal GLMM for Infectious Disease Hotspot Forecasting: Evidence from Metapopulation Data. J Biomed Sci.1:1.
Copyright: © 2025 Amuda B, et al. This is an open-access article distributed under the terms of the Creative Commons Attribution License, which permits unrestricted use, distribution, and reproduction in any medium, provided the original author and source are credited.
